IDEs & Debugging
Debugging
The term debugging has two main meanings. Firstly, it's the process by which you find and resolve problems or bugs in your code. Secondly, it's the use of a debugger which is a tool which lets you inspect the state of your program as it's running.
Most programming languages come with some way of running their programs through a debugger, C and C++ have gdb on Linux for example and Python comes with a tool called pdb. These tools are usually used in the command-line in a text-based environment. One of the most useful features of IDEs is that the allow you a more graphical and easy to use interface to debuggers.
When you can't work out why your program is not working you may be used to sprinkling print functions all over the place to narrow down where the problem is. This is both potentially disruptive to the code and it means that you have to decide up-front where you think the problem is and what variables are of note. Using a debugger allows you to move through the program looking at everything that the program knows about.
Let's start by making a new file called debug.py with the following contents:
a = 5

b = 6

c = a + b

print(c)
First, let's simply run this script through the debugger to see what happens.
Click on the green insect icon in the top right of the screen. It should be right next to the green play button.
Go to the Debug menu at the top of the screen and select Start Debugging or press F5. If you are asked at this point to Select a debug configuration, select Python File.
You will see that a tab at the bottom of the screen is opened and somewhere in there, the output of the print is displayed as 11.
Breakpoints
You'd be forgiven for thinking that what we just did was no different from before when we ran our script normally. In fact it was being run in a special mode where it is keeping track of everything as it goes along. This is only really useful if we can tell the program to pause at certain points so that we can, for example, look at the values of the variables.
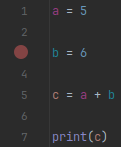
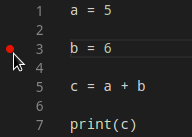
The way that we tell the IDE to pause at a certain point in the program is by placing a breakpoint. You place a breakpoint by clicking in the gutter on the left of the text editing area next to the line numbers.
In PyCharm you will need to click on the line numbers:
In VS Code you will need to click just to the left of the line numbers:
Place a breakpoint on line 3 of debug.py.
Debugging layout
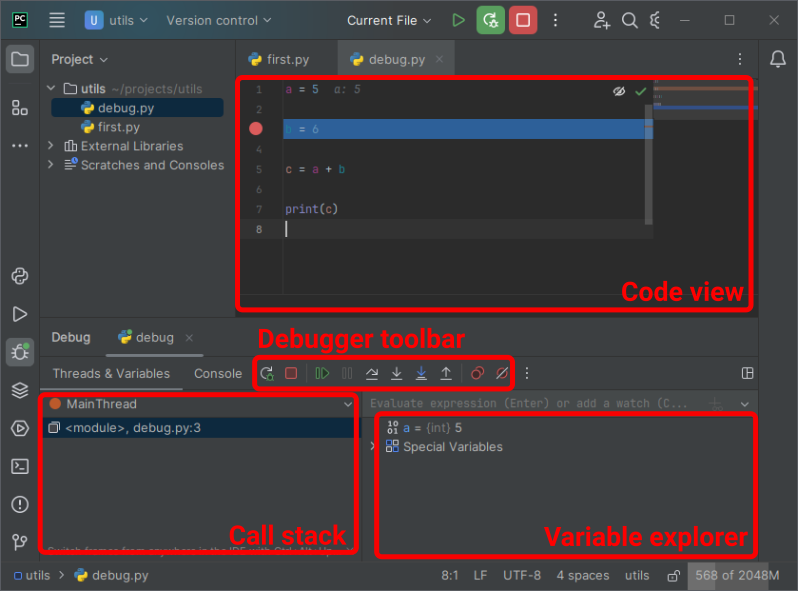
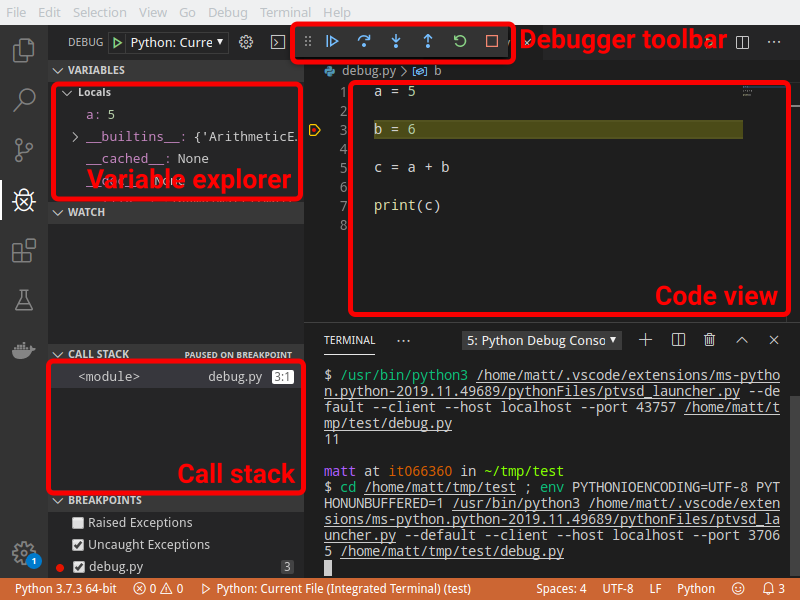
Now that we have placed a breakpoint, go ahead and run the debugger again. You should see the screen change mode into a debug view. In the debug view you will see the code file that is currently being executed, a list of the variables currently in scope along with their values, the call stack where you see the nested functions that you are currently inside and a toolbar or two giving you control over the debugger:
In PyCharm the debug toolkit is opened as a tab at the bottom of the screen. In the bottom right we see the variable explorer which gives us the name, type and value of all the variables in scope. To the left of this there is the call stack viewer (called "Frames" in PyCharm). Above this we see the debug toolbar, this is where we find the tools to control the debugger.
In VS Code the debug toolkit is opened by changing the mode of the IDE. You'll see that on the far left of the screen the mode has changed from the "two pieces of paper" Explorer mode to the "insect" Debug mode.
In the top left we see the variable explorer which gives us the name and value of all the variables in scope. In the bottom-left we see the call stack view. Towards the top of the screen we see the debug toolbar. This is where we find the tools to control the debugger.
Variable explorer
The variable explorer is probably the most useful part of the debugger. Right now the execution is paused at our breakpoint on line 3. If we look at the list of variables that are shown we only see a. This means that it has not yet run the code b = 6 and this tells us that when the debugger pauses on a line, it is before the contents of that line of code have been executed.


If we look at the value of the variable a, we see that it is 5, as we defined it to be.
Now that we've checked the value of the variable a and it matches what we expect, we can let the program run to completion.
In the debug toolbar there is a green "play" button:

In the debug toolbar there is a blue "play" button:

Click the Continue/Resume button and the Python script will complete and print 11 as it did before.
Stepping over
Let's try that again and this time see if we can move the degubber slowly through the program to see how the state evolves.
Start the debug session in the same way as before and this time when it pauses at the breakpoint on line 3, find the "Step Over" button:
In the debug toolbar there is a button with a blue arched arrow:

In the debug toolbar there is a button with a blue arched arrow:

Press this button and it will cause the debugger to execute the current line (line 3) and move to the next line of code. You'll see that the variable explorer has now updated to also have the variable b with the value of 6.
In PyCharm, you will also see that the value of the variable is also shown in the code view:
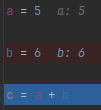

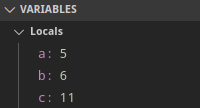
Press Step Over once more and line 5 will be exected and the control will move to the last line. Once more, the variable list will show the newly-defined variable c with the value 11. Since we now know for sure that c is 11 and we are about to print(c) then we would expect the print statement to output 11 (as we have indeed been seeing so far).

Finally, press step over once more to let the program execution complete. Alternatively, press the Continue/Resume button or the Stop button if you can find it.
Make sure to remove the breakpoint we added by clicking on it in the gutter.
Stepping in and out
To "step over" means to let the execution of the program continue until it get to the next line of code at which point the debugger will pause again. There are common situations where we don't want to let execution continue that far and instead want to take a more fine-grained approach.
Let's make our script a little more complex by adding in a function:
def my_fn():
    j = 42
    m = 32
    r = j/m
    return r


a = 5
b = my_fn()
c = a + b
print(c)
This script is very similar to the previous one except that instead of b being defined as 6, the value is coming from a function.
Put a breakpoint on line 8 (a = 5) and make sure that there are no other breakpoints set. Then start the debugger once more.
At the point that the debugger pauses, no variables have yet been defined. Press Step Over to move on to line 9 (b = my_fn()). You should now see that a has been set to 5.
Now that we're sitting on a line with a function call, find the "Step Into" button:
In the debug toolbar there are two buttons with downward arrows. The first of which is a standard "step into". The second does the same but will only step into code from your projects which helps avoid stepping into third-party code from libraries you're using etc.

In the debug toolbar there is a button with a blue downward arrow:

Press the "Step Into" button and you'll see that execution jumps to line 2 (j = 42) rather than moving on to line 10. We're now looking inside the function we created and so can see how the return value is constructed. Since we are now inside a function with its own local scope, the variable list is empty. Also, if you look at the call stack pane you'll see that in addition to <module> which is the global namespace, there's a item called my_fn on the stack. It's keeping track of which functions we're inside.
Press "Step Over" to move on to line 3 and you'll see that the variable j is set and displayed in the explorer.
At this point we could continue to press "Step Over" until we reached the end of the function, at which point we would be returned to line 10. However, let's try doing the opposite of "Step Into", "Step Out":
In the debug toolbar there is a button with a blue upward arrow:

In the debug toolbar there is a button with a blue upward arrow:

Press this button and you will see the call stack pane change to remove my_fn and just have <module>. This tells us that we're no longer inside the function. Control is still on line 9 as it is after my_fn() has returned but before the value has been assigned to b. Press "Step Over" to move on to line 10.
Stop the debugger by pressing the stop button:
In the debug toolbar there is a button with a red square:

In the debug toolbar there is a button with a red square:

Now that you have these tools at your disposal, you should be able to avoid having to do "print debugging" and will be able to find and fix errors in your code much more easily.
Exercise
Edit debug.py to look like:
import string


def obscure():
    j = len(string.punctuation)
    m = 7
    return (j * m) % 19


a = obscure()
print(a)
This code is designed to set a variable, j, with some supposedly unknown value and then do some arithmetic on it (multiplication and modulus) such that from the outside you cannot determine the value of j.
Do not edit the code in any way. The only breakpoint you should set is on line 10 (a = obscure()).
Use the debugger to find the value of j.
Catching exceptions
A common problem that you might want to debug is when your code (or some other code you're calling) raises an exception which causes your script to exit. By default the IDE has a "virtual breakpoint" for when any uncaught exception is raised.
Edit debug.py to look like:
import datetime
import string

puncs = len(string.punctuation)
year = datetime.date.today().year
ppy = puncs // year

d = 42 / ppy

print(d)
If we run it we see that there's an issue with it with causes it to exit with an exception:
Traceback (most recent call last):
  File "/home/matt/PycharmProjects/utils/debug.py", line 8, in <module>
    d = 42 / ppy
ZeroDivisionError: division by zero
It's raised an exception on the line where we divide 42 by the variable ppy.
If we want to examine exactly why this happened a debugger is probably the best tool. Go ahead and run the script again but this time through the debugger, making sure that you've cleared any break points you still have in.
You'll see that even though we didn't manually place any breakpoints, the IDE has still paused on the line that raised the exception.
Instead of the red circle next to the line number, there's a small red lightning bolt on the line where it has paused.
When an exception is caught by the debugger, VS Code provides a very nice popup which gives the output of the exception in-line.
All other features of the debugger remain the same so we can still look at the variable explorer. We see there that puncs is equal to 32 and year is 2020 (at the time of writing). ppy is calculated by dividing puncs by year using //. This type of division in Python only gives the whole number of times year can fit into puncs and so results in a 0.